
Βatches of uncoated tablets in CAPRI
We produced several batches of uncoated tablets at the AMS facilities in Poland. We have used optical coherence tomography (OCT) to establish baseline profiles and have assessed dissolution behavior according to PH. Eur.
The batches differed in the liquid-to-solid (L/S) ratio (i.e., in the amount of granulation liquid). The following batches were thoroughly tested and analyzed:
• Z010-1347 (main compression force 11.1kN, L/S ratio 24%),
• Z010-1350 (main compression force 11.1kN, L/S ratio 27%),
• Z010-1353 (main compression force 11.1kN, L/S ratio 30%).
Based on the results and data, RCPE has developed a proprietary model to predict the bioavailability of small amounts of API. The model satisfactorily corresponds to the experimentally-obtained dissolution profiles. Therefore, it demonstrates that it is possible to determine and predict dissolution profiles in continuous production environments with in-line, real-time measurements.

We have repeated these tests after nine months of storage in HDPE bottles to assess the model's and OCT's ability to predict changes in dissolution behavior successfully. We took new OCT images, and the stored tablets' surface was redimensioned and reanalyzed. Consequently, we reassessed the API release profile. At the same time, new (traditional) dissolution tests were performed under the same conditions as for the newly-produced tablets.
The following graphs show the dissolution profiles for each of the three batches. You can see that the dissolution profiles don't change or only very little over time. It also shows that the model has predicted more considerable variations in dissolution. Morphological changes in the tablets' surface appear to affect the prediction while having virtually no (or only very little) impact on dissolution. We will be expanding the model's data set and retraining its algorithm using a series of measurements taken at specific intervals (e.g., every two weeks) over a prolonged time (> nine months) to incorporate and consider these findings.
Several batches of uncoated tablets were produced as part of the work related to the introduction of cognitive tools to pharmaceutical production. OCT and dissolution profiles were measured according to Ph. Eur. Based on the results, RCPE created a model to predict the availability of small amounts of API from tablets. The model satisfactorily corresponds to the obtained dissolution profiles. After 9 months of storage of the tablets in HDPE bottles, the tests were repeated.
Representative batches from each other in the ratio of liquid to solid (L/S) state (i.e., in the amount of granulation liquid) were selected.
• Z010-1347 (main compression force 11.1kN, L/S ratio 24%),
• Z010-1350 (main compression force 11.1kN, L/S ratio 27%),
• Z010-1353 (main compression force 11.1kN, L/S ratio 30%).
Based on the OCT images taken at the AMS, the surfaces of the tablets were dimensioned and analyzed in detail. Then, on this basis, the ability to release API for each batch of tablets was assessed. At the same time, new dissolution tests were performed for the tablets after storage under the same conditions as for the first experiment.
The aim of the earlier experiment within the project was to show that in the continuous process of producing tablets from granules, it is possible to determine in-line what the dissolution profile will look like. However, the above experiment will complement the knowledge on whether the approach is also adequate in the case of stored samples of manufactured tablets for a certain period of time under normal conditions.
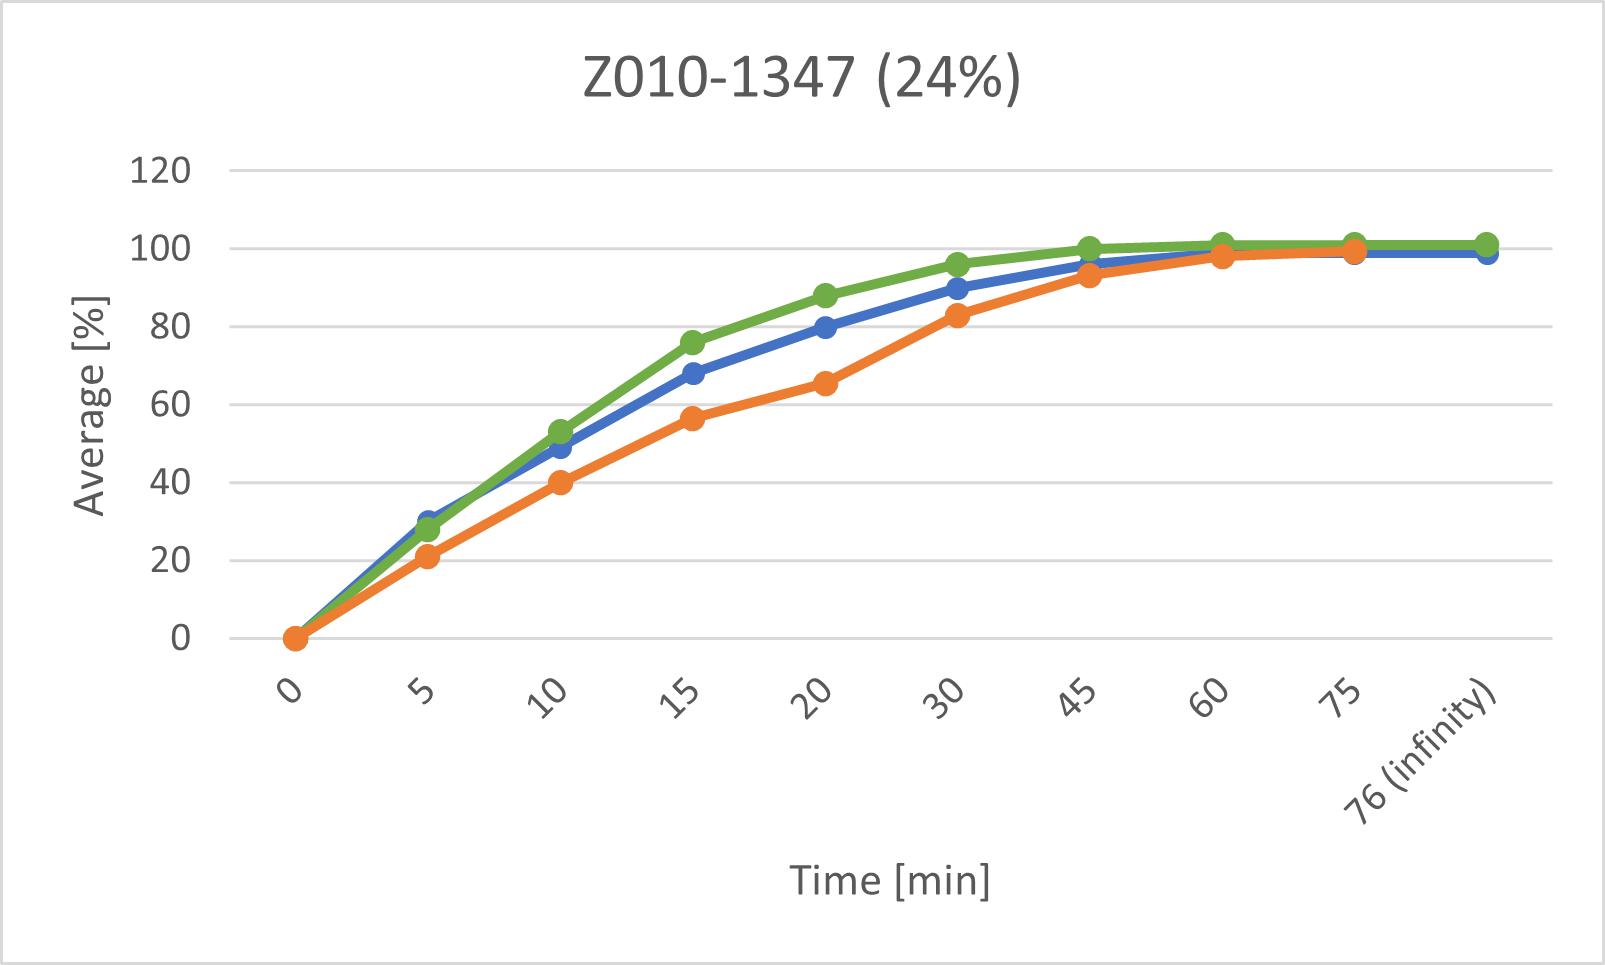
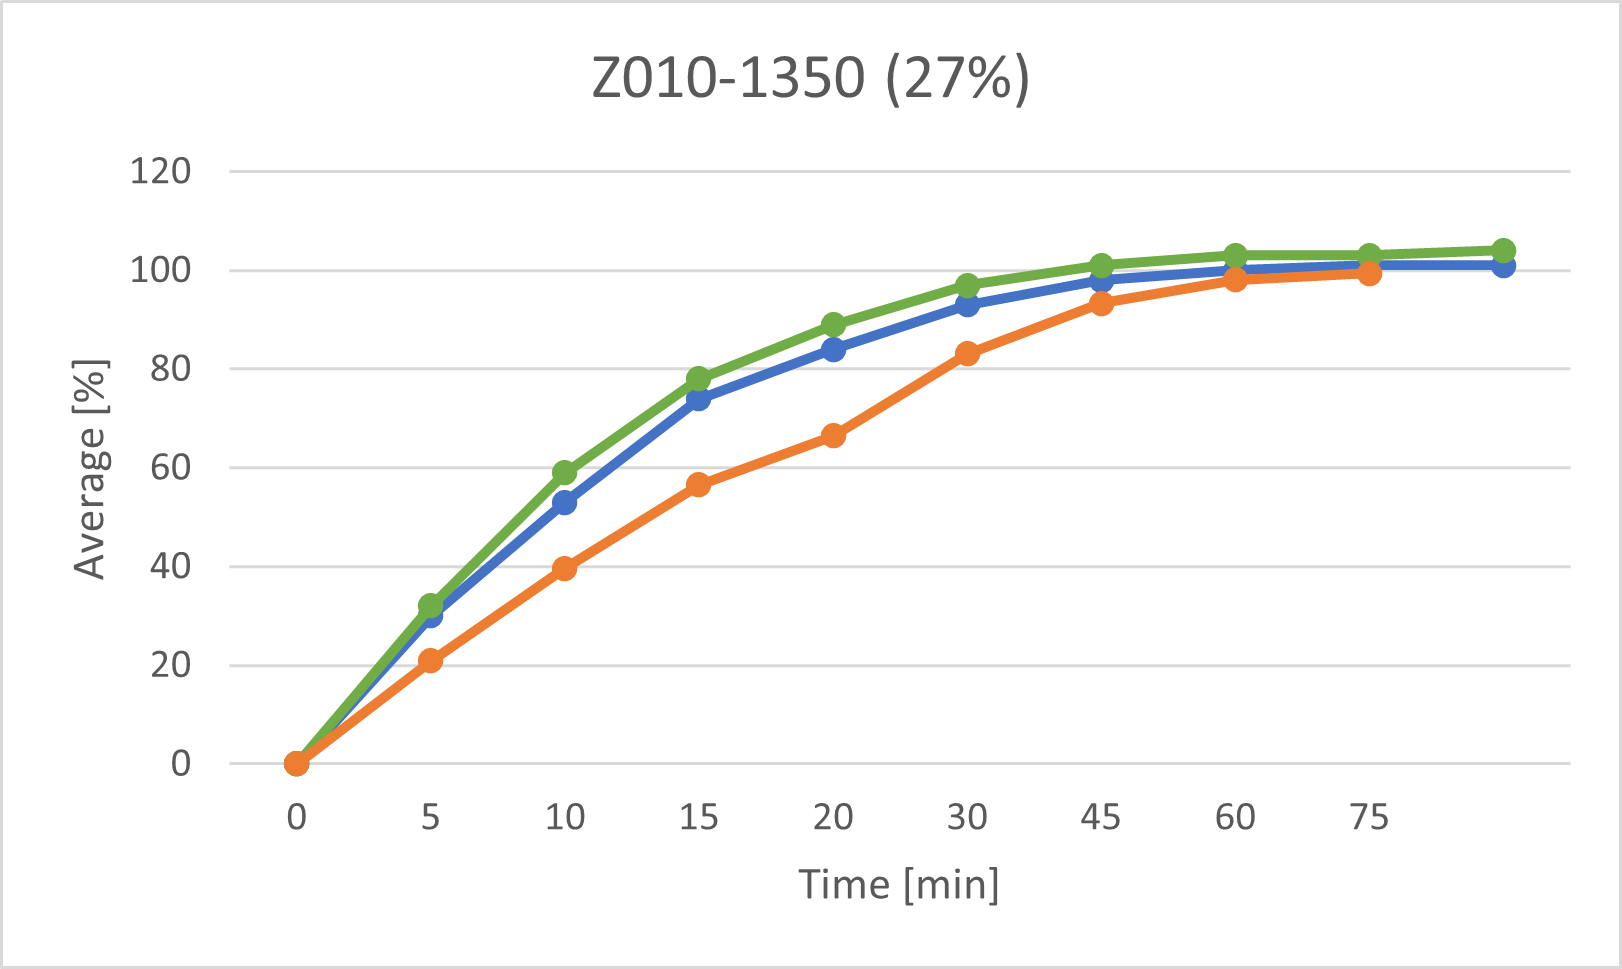
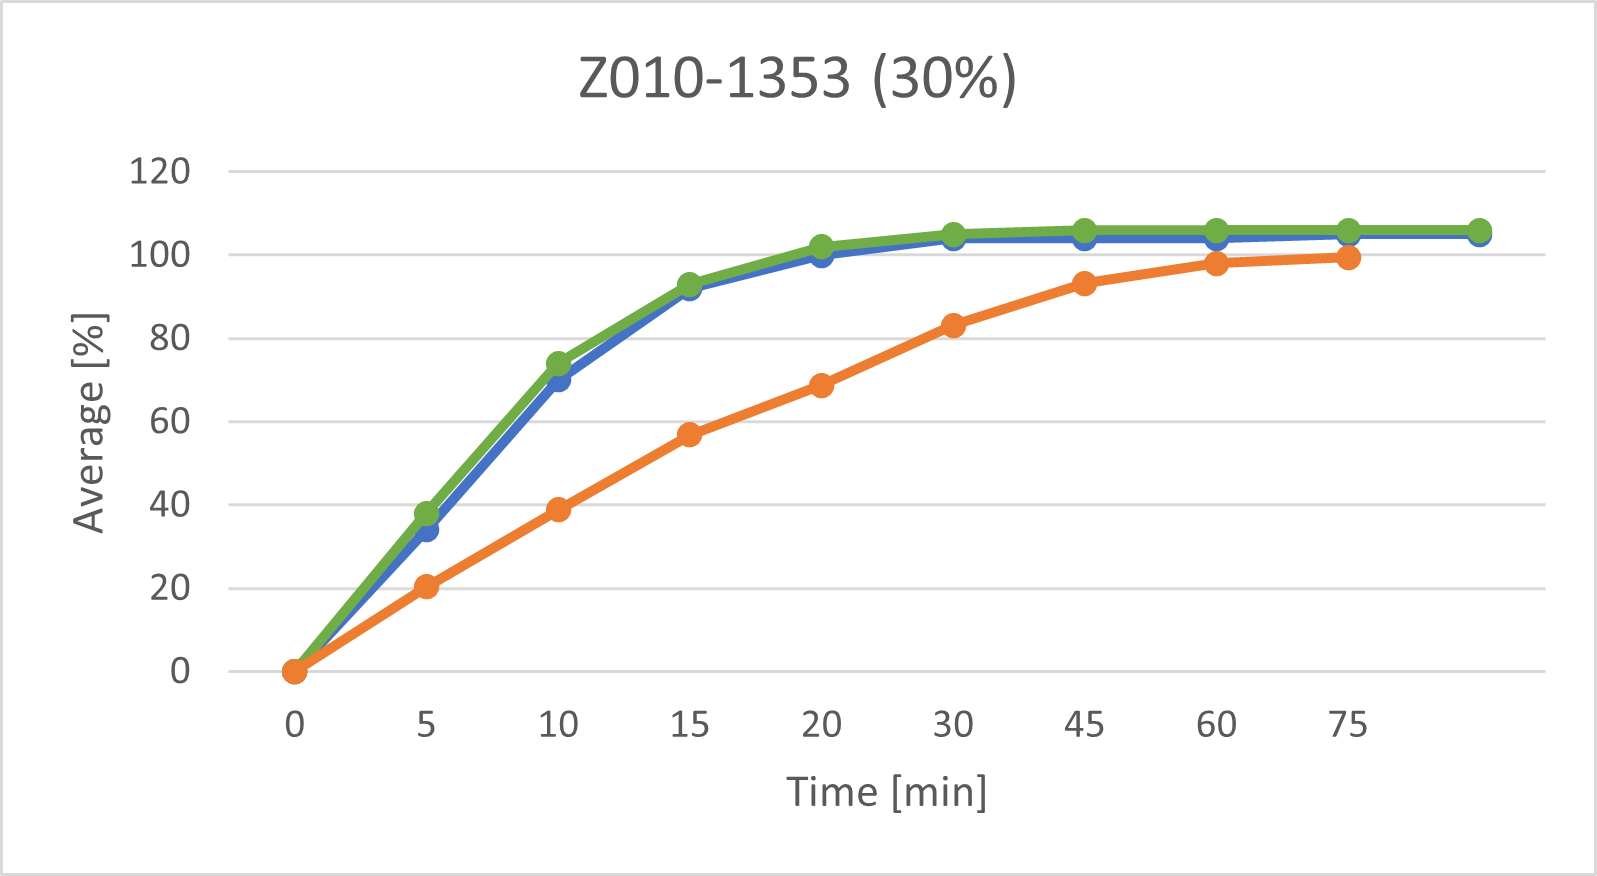
The above graphs show the dissolution profiles for each of the three baches, the results for the first test and the after storage test performed with the classic analytical method and the prediction model based on measurements of the tablet surface are marked respectively.
The release profiles for each of the baches do not change or change very little over time
These results indicate that the model trained with data from tablets measured shortly after production has certain limitations when predicting the dissolution properties of tablets after a longer storage time (9 months). It is suspected, that the morphology of the tablet changes slightly over time- these changes are then captured in the OCT images, but do not (or very little) affect dissolution. In a next step, OCT measurements of stored tablets will be taken in periodic intervals(e.g. every two weeks) over a prolonged time (> 9 months). Then the model will be adapted to include changes over time.